Thread Analysis
Click on [Thread Analysis] under Application Instance Components to enter the thread analysis interface.
Thread Analysis Interface
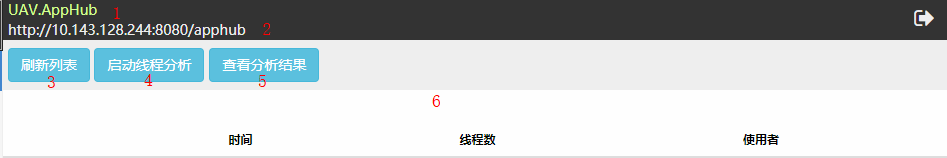
- Name of the application cluster
- Name of the application instance
- Refresh the List
- Start Thread Analysis
- View Analysis Results
- Results
Refresh the List
Click on [Refresh the List] several seconds later after successful thread analysis to display the thread analysis history of the application instance.
Start Thread Analysis
Click on [Start Thread Analysis] and choose [Single Thread Analysis] or [Multiple Thread Analyses] in the pop-up dialog box.
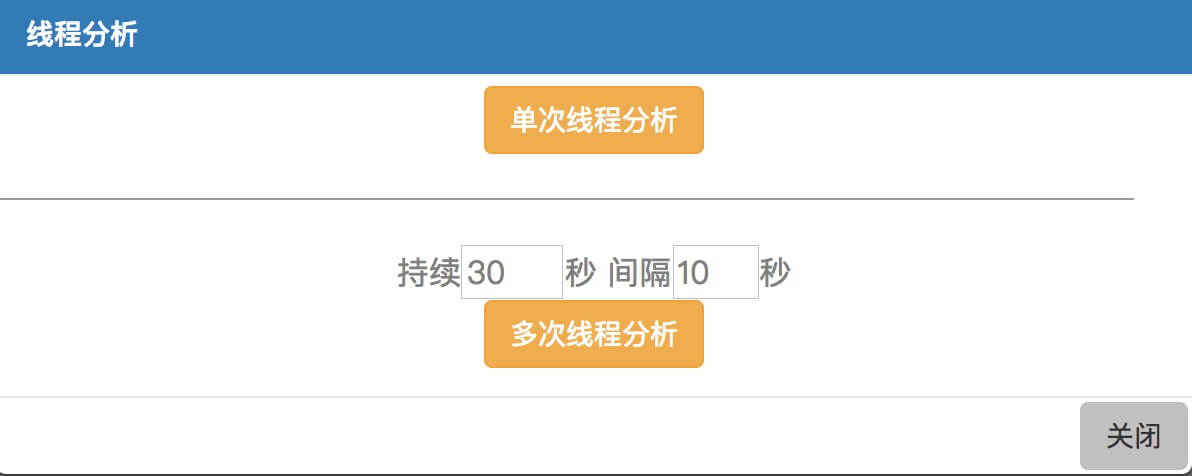
Single thread analysis:
Perform thread analysis once. Refresh the list after successful analysis to view results.Multiple thread analyses:
Perform multiple thread analyses in 30 seconds (adjustable) at 10-second intervals (adjustable) by default. Results of the first analysis shall be notified. Susequent analyses shall run automatically at the backend.
Start thread analysis. Dialog box below
indicates successful analysis.
Thread Analysis History
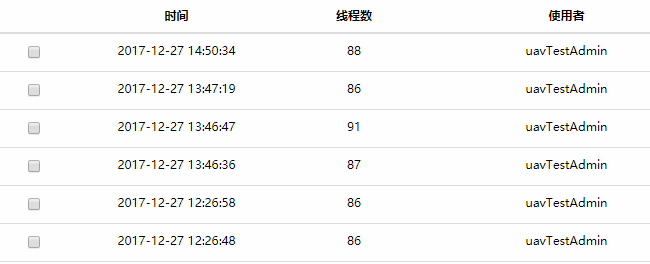
Thread analysis history records the time of previous thread analyses, the thread count of the current analysis and the name of the user. Check one analysis record and click on View Analysis Results to view the result of the current analysis. Check multiple records and click on View Analysis Results for the snapshot analysis results of multiple thread analyses in the chronological order.
View Analysis Results
Single Snapshot Analysis Results
The list displays the thread No., the CPU use rate, the memory use rate (same as that shown in the top command), the status of each thread and the thread stack information of all threads analyzed in the current snapshot. Threads are displayed according to the CPU use rate from high to low.
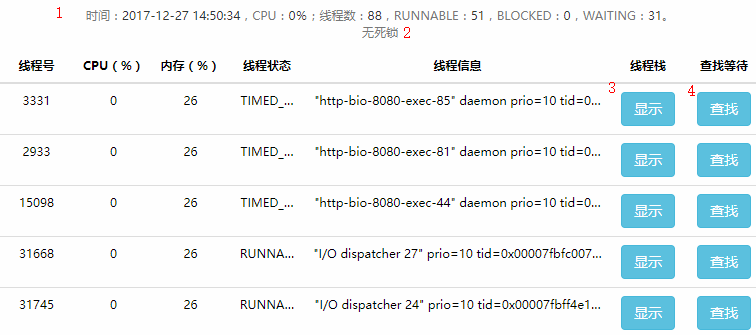
- Time when the thread is captured, total CPU use rate, total thread count and thread counts of each status.
- Automatically detect deadlocks in the thread. A red button with [Deadlock] would pop up here if any deadlock is detected. Click to view the thread information of the deadlock
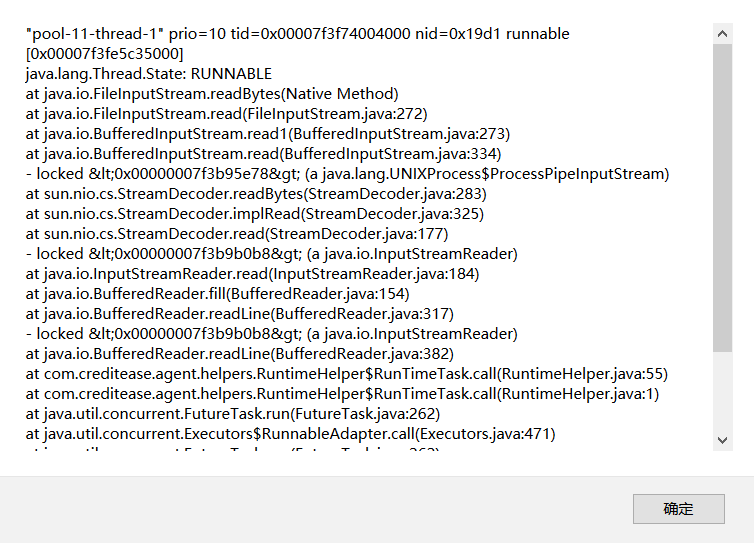
- Click on [Display] for detailed thread stack information of the thread.
- Click on [Search] to check whether this thread depends on other threads. If no, the pop-up box indicates no dependence; if yes, get to the detailed page for the dependence list.
Multiple Snapshot Analysis Results
The list displays the status of each thread at different time. The header includes the time when each snapshot is captured, which is shown in the chronological order. Different thread status is colored differently. See Legends for colors.
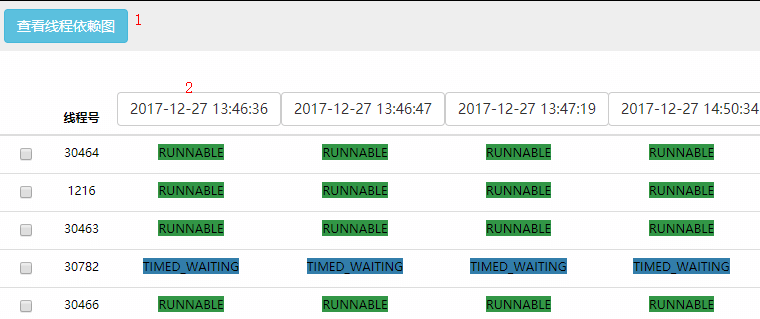
Check the thread to be viewed and click on [View Thread Dependence Graph] for the dependence graph in the chronological order. Legends:
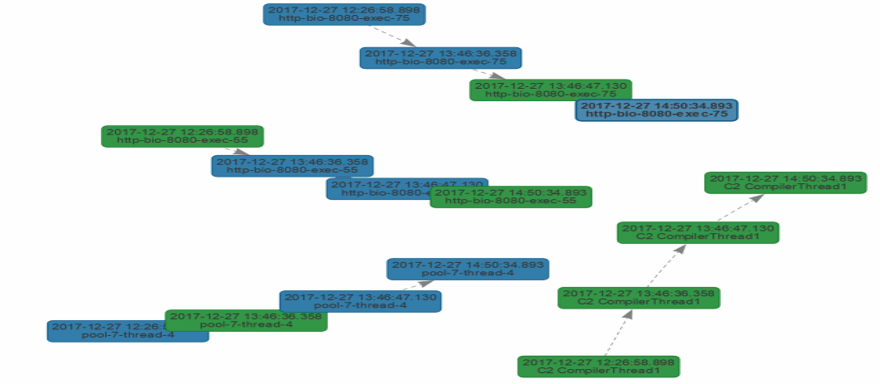
Click on the time in the header to view the complete graph of the thread status captured this time. Legends:
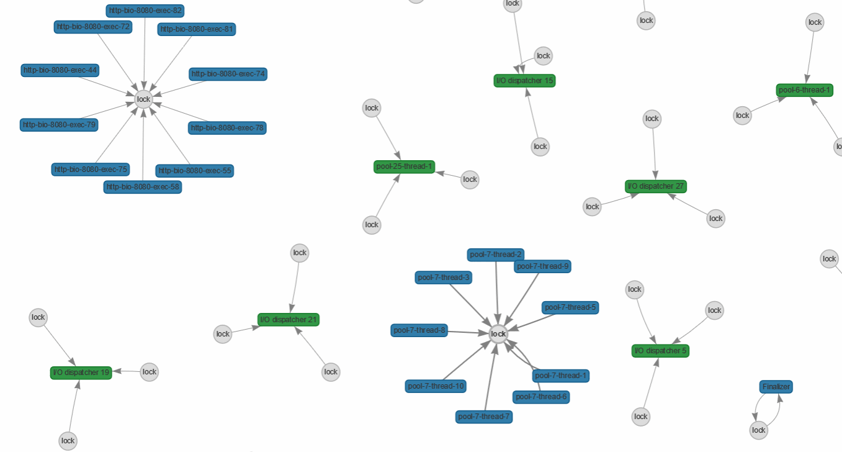
Legends in Thread Graph
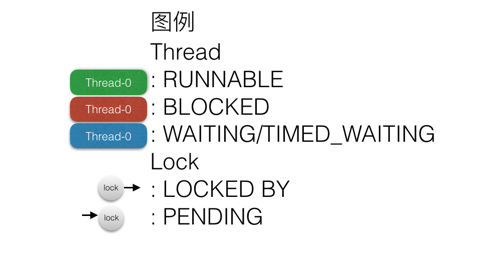
- Thread status: RUNNABLE in green, BLOCKED in red, and WAITING and TIMED_WAITING in blue
- Arrows on lock: The arrow points at the thread from the lock when the lock depends on the thread, and vice versa