Invocation Chain Tracing
Click on [Invocation Chain Tracing] under Application Instance Components to enter the invocation chain tracing interface.
Invocation Chain Interface
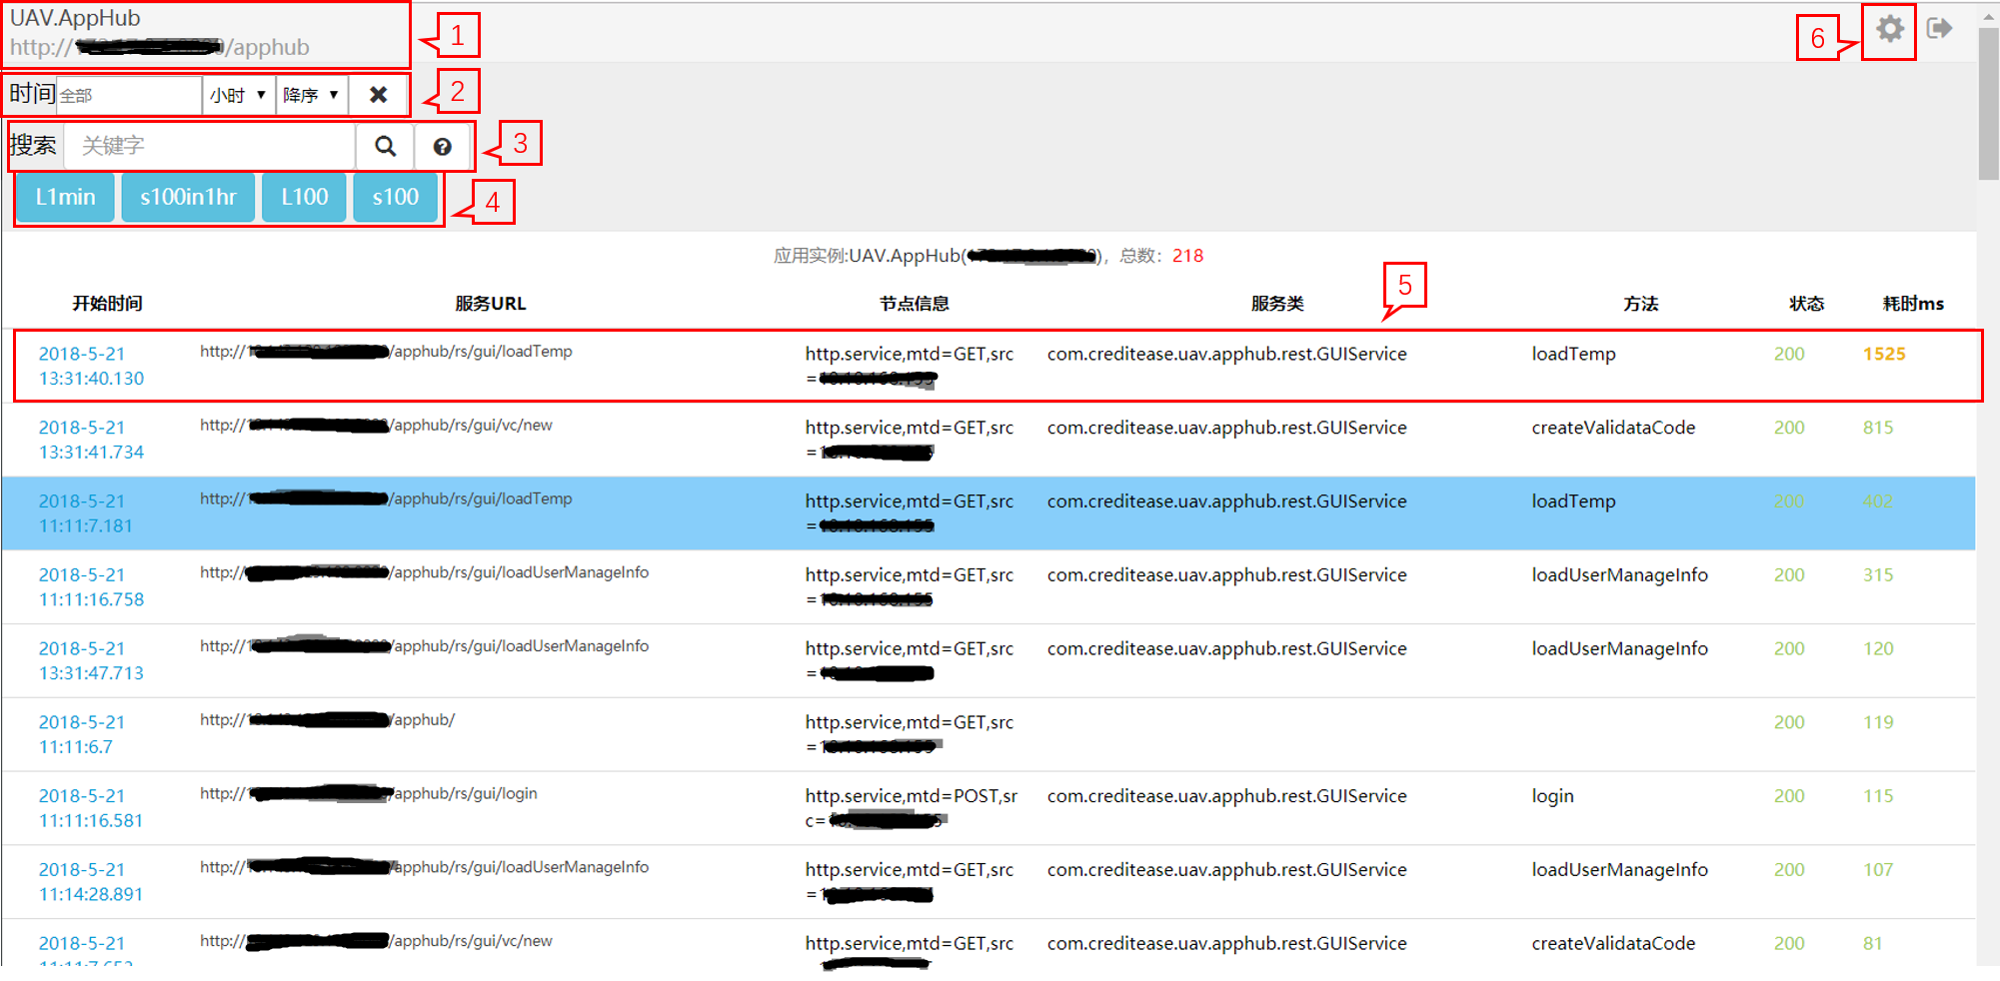
1) Display the name and URL of an application instance: 2) Search for invocation chain data during specified time intervals. Specify time with the same method as that of the application log query. From left to right:
- Time: [All] denotes total time;
Time setting
- By the day: click on [All] to pop up the calendar and specify the date;
- By the hour: click on [All] to pop up the calendar and specify the date and the hour;
- By the minute: click on [All] to pop up the calendar and specify the date, the hour and the minute;
Sort by: [Ascending] or [Descending]
 : clear the specified time back to [All]
3) Keyword query of invocation chains 4) Quick query buttons that support common query;
- L1min: view service requests within the latest 1 minute;
- s100in1hr: view the slowest 100 service requests within the latest 1 hour;
- L100: view the latest 100 service requests within 24 hours;
- s100: view the slowest 100 service requests within 24 hours;
5) Click to view the invocation chain details
6) Click to enable or disable the invocation chain and log correlation functionality
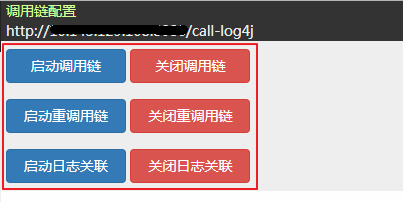
Click on [Enable] or [Disable] to enable (/disable) the invocation chains\ (/heavyweight invocation chains / log correlation) functionality. Note: enable the invocation chain functionality first when using the heavyweight invocation chain or log correlation functionality because the latter two depend on the invocation chain functionality.