Application Cluster Performance
Application Cluster Metrics
Application performance:
- QPM: QPM total of all application instances
- Response time: whole-process average response time of all application instances
- Error count: error total of all application instances
Application instance performance:
Each application instance is identified with No.+Application ID. QPM, response time, error count and access time of each instance are listed
- QPM: quantity per minute
- Whole-process average response time: accumulative average response time since application startup
- Response time of the current minute: response time within the most recent 1 minute
- Error: error count within the most recent 1 minute (Http response codes: 4XX and 5XX)
- Access time: time of the latest access

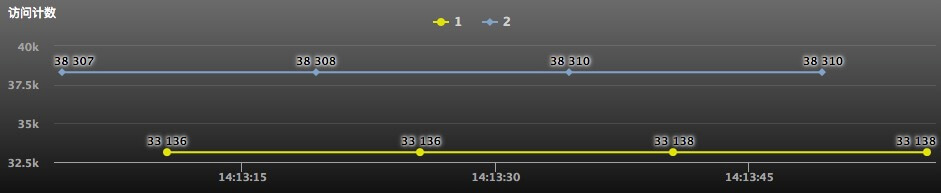
Access Count
List the accumulative access count of each application in the sequential order
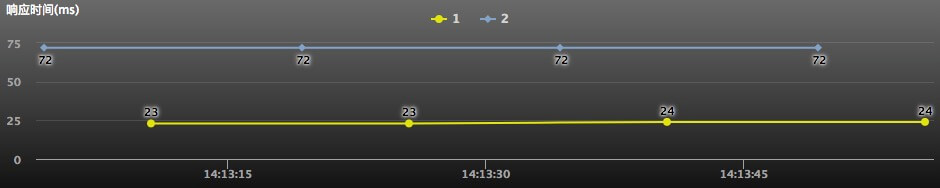
Response Time
List the whole-process response time of each application in the sequential order
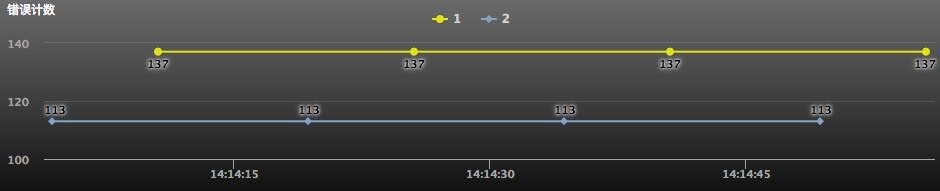
Error Count
List the accumulative error count of each application in the sequential order