Service Flow
Terms
Service Flow
refers to the graph which depicts the static network topology and runtime properties among services.
Static Network Topology
describes the relations between service ontology and services.
Runtime Properties
mainly describes monitoring metrics during service process and invocation process.
Service Process Metrics
refers to addresses accessed, operation methods, request/response content, response time, throughput, error count and access timestamp, etc..
Invocation Process Metrics
refers to invocation addresses, operation methods, request/response content, exception/error count, invocation volume, invocation timestamp and invocation service properties (service type, cluster or not, version, user/access) etc..
Two Levels of Service Flow Graph
Example of Service Flow Graph
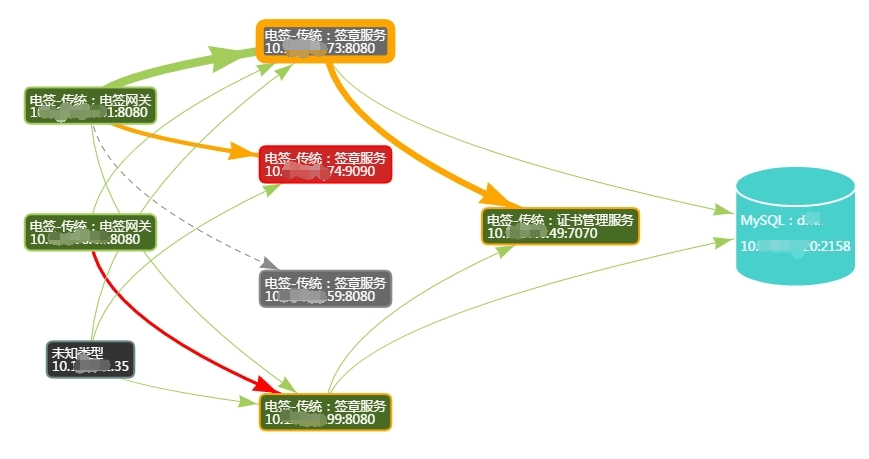
Illustration of Legends in Service Flow Graph
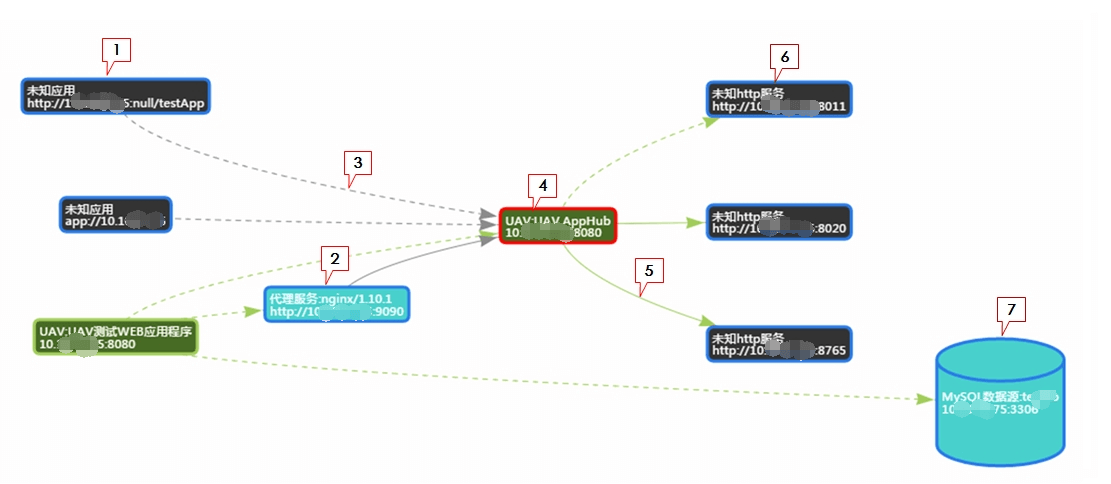
1. Unknown Applications
Unidentifiable applications without UAV.
2. Proxy Service
Partially identifiable services without UAV.
3. Access Request
Provenance-based access request with access time but no performance data
- Solid linesindicate access within the current minure
- Dotted linesindicate access one minute earlier
- Click to get to the provenance awareness details interface
- Hover the cursor to display the time of the latest access
4. Application Instance
Applications with UAV.
- Thickness of border lines indicates access volume
- Color of border lines indicates the health condition of access, including both response time and error count. Green for sound, yellow for warning, and red for severe
- Color of background indicates the survival condition of application instances. Green for sound, red for dying (or delayed heartbeat) and grey for dead
- Click to get to the Application Instance Performance interface
- Hover the cursor to display qpm, average response time, error count and the time of the latest access
5. Client Invocation
Outbound invocation request of application instances with performance data and access time.
- Solid linesindicate invocation within the current minure
- Dotted linesindicate invocation one minute earlier
- Thickness of border lines indicates invocation volume
- Color of border lines indicates the health condition of invocation, including both response time and error count. Green for sound, yellow for warning, and red for severe
- Click to get to the Client Component Performance interface
- Hover the cursor to display the time of the latest access
6. Unknown Http Service
Without UAV and detected upon invocation
7. Data Source
Without UAV and detected upon invocation of defined types as below
- Database: Oracle/Mysql
- Cache: Redis
- NoSQL: MongoDB
- Message middleware: RabbitMQ,RocketMQ
Provenance Awareness Details
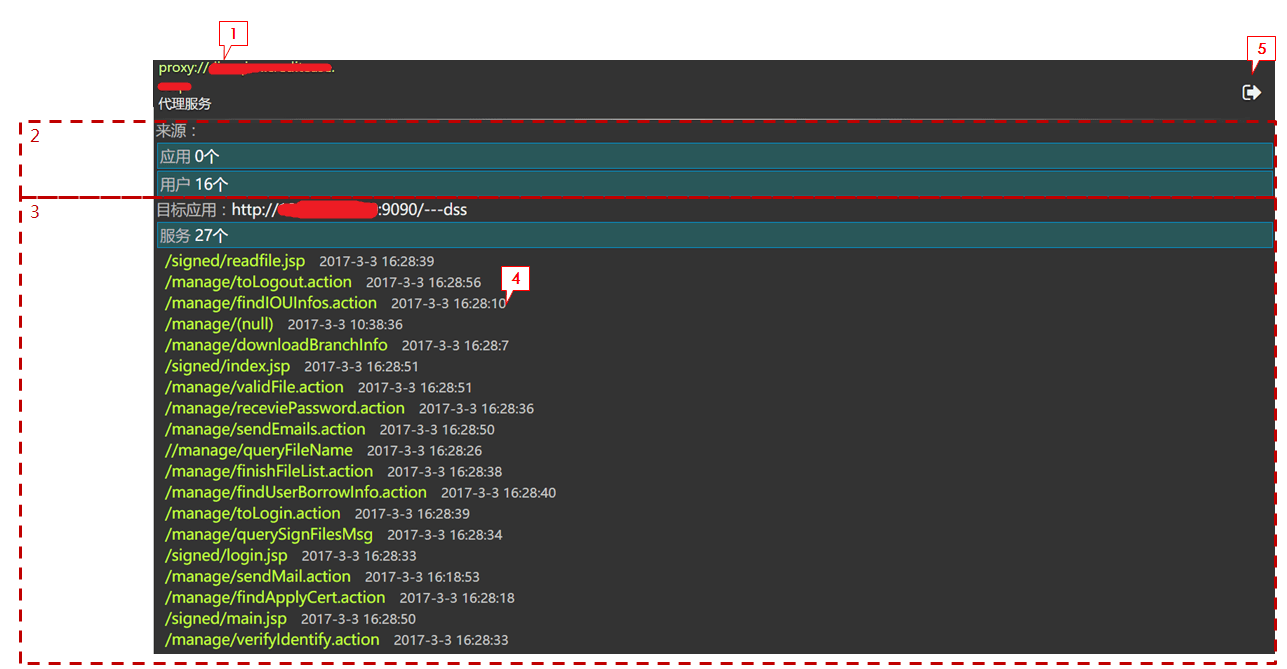
1. Access Source IP
Proxy services or directly connecting IP.
2. IP Source List
Click on the blue area for detailed IP list and the time of the latest access to each IP.
3. List of accessed services
Click on the blue box for detailed URL list of accessed services and the time of the latest access to each service.
4. Time of the latest access
Time of the latest access in the format of Year_Month_Day Hour:Minute:Second
5. Exit
Click to get back to the service flow interface