Alarm Action
Alarm actions include mail, SMS, HTTP interface and thread analysis.
1. Subject
Alarm overview.
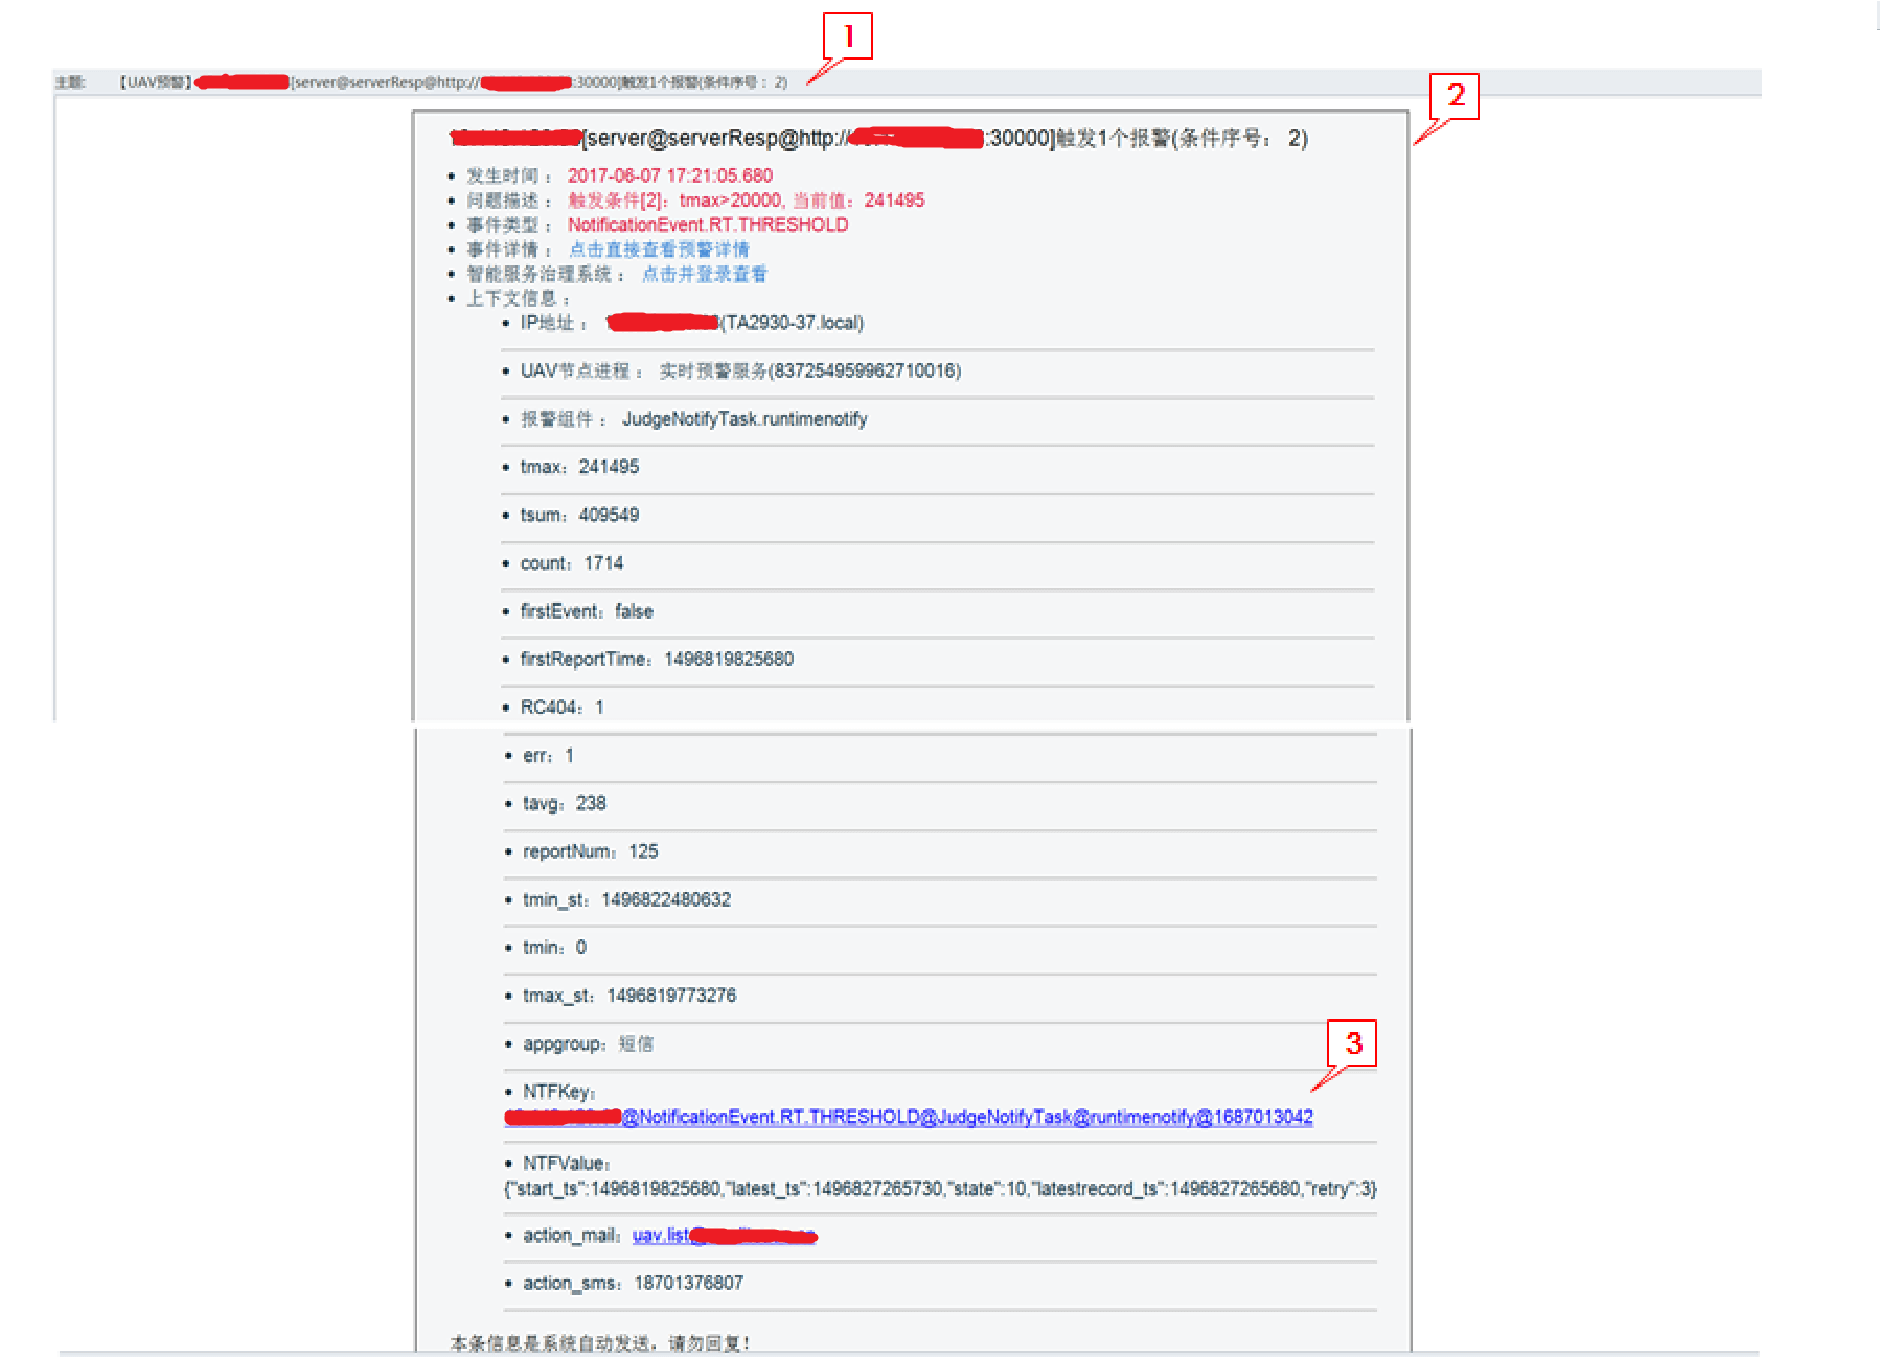
2. Body
Alarm details. Same as the information in Alarm Details.
3. Alarm Link
Click to get to the Alarm Details interface.
SMS
Content:
<UAV alarm> ${time} , ${title} event happened. Log into the mailbox for details.
- time: time when the alarm event happens
- title: alarm overview. Same as the subject of the mail
HTTP Interface
Send HTTP request alarm to the configured URL
- method: POST
- content-type: application/json
- encoding: utf-8
body: alarm event
JSON example of alarm event:
{
"createtime": 1497602705129,
"time": 1497602705070,
"title": “10.143.128.245[server@serverResp@http://10.143.128.245:10101] triggers 1 alarm (No. of the Condition: 1)",
"host": "TA70-35.local",
"_id": {
"timestamp": 1497602705,
"time": 1497602705000,
"machineIdentifier": 6375121,
"processIdentifier": 5138,
"counter": 13251776,
"timeSecond": 1497602705,
"date": 1497602705000
},
"description": “Triggering condition [1]: the avg value of tavg within 120 seconds >7000, the current value: 12316.0\n\r",
"args": {
"tmax": "12316",
"tsum": "12316",
"count": "1",
"firstReportTime": "1497600725070",
"nodeuuid": "837254959962710016",
"action_mail": "uav.list@creditease.cn",
"component": "JudgeNotifyTask",
"RC200": "1",
"tavg": "12316",
"action_sms": "18701376807",
"nodename": “realtime alarming service",
"feature": "runtimenotify",
"reportNum": " 34 ",
"tmin_st": " 1497600657436 ",
"tmin": "12316",
"tmax_st": " 1497600657436 ",
"appgroup": "UAV"
},
"ntfkey": "10.143.128.245@NotificationEvent.RT.THRESHOLD@JudgeNotifyTask@runtimenotify@-1344647425",
"firstrecord": "false",
"eventid": "NotificationEvent.RT.THRESHOLD",
"appgroup": "UAV",
"ip": " 10.143.128.245 "
}
Thread Analysis
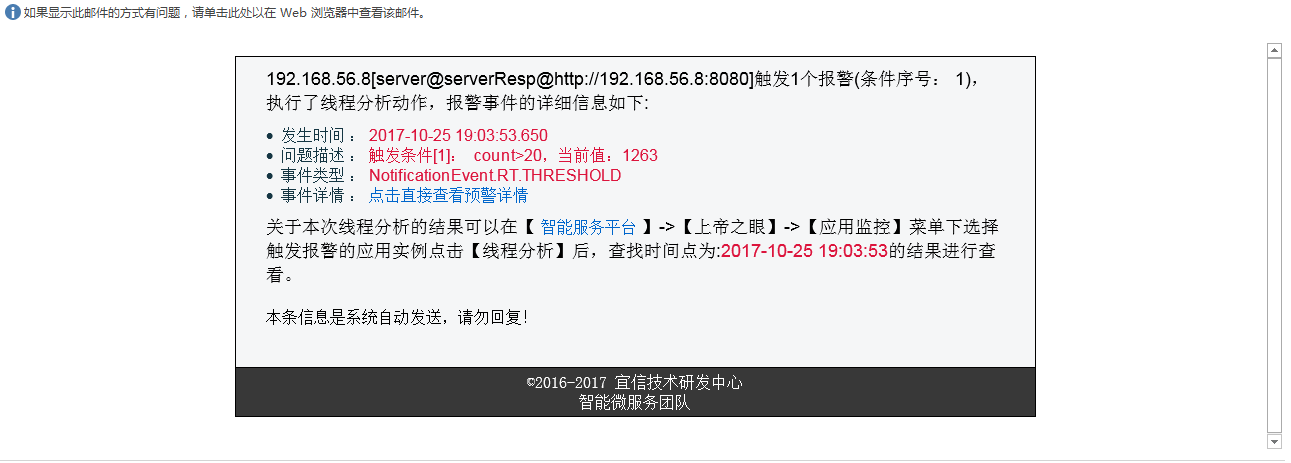
Thread analysis refers to the automatic thread analysis performed after alarm events happen. Thread dump during the alarm event is saved. At present, thread analysis supports strategies below:
- At the server: metric system of service status, metric system of application status and metric system of application server status
- At the client: metric system of invocation status
Click on [Thread analysis] under Application Instance Components of the application instance which triggers the alarm action and get to the thread analysis interface. Check the thread analysis results according to the time when the alarm event happens. In addition, if the user has configured mail notification, then an email shall be sent to the user after successful thread analysis. Below is the format of the mail: