Application Log Query
Log Collection Configuration
Enable or disable log collection in the Log Collection Configuration interface under Application Instance Components of the [Application Monitoring] interface
Log Components

- Application name
- Log path
- Name of log file
- Click to specify time
- Click to specify the time scale
- Choose [Ascending] or [Descending]
- Enter any keyword to query logs
- Click to clear the specified time
- Click to search for results
- Results
Specify Time
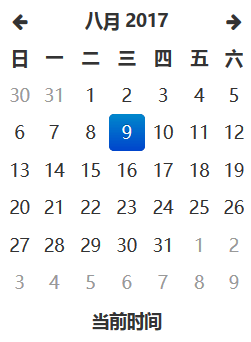
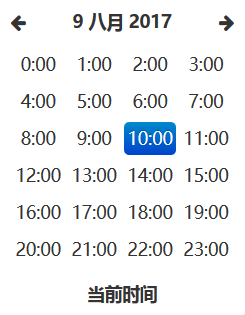
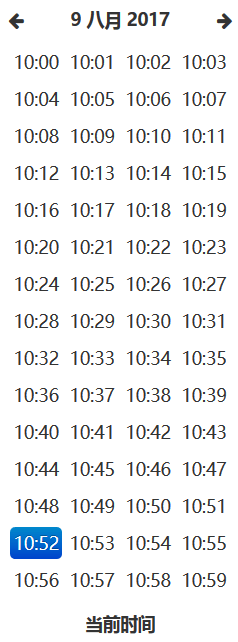
Click to specify the time scale before specifying time. For instance,
By the day:
By the hour:
By the minute:
Specify the Time Scale
The time scales by day, hour and minute support log query within the specified day, hour and minute.
Query Logs
Hover the cursor around [Keyword] in the inpu box right after [Query] to view keyword rules:
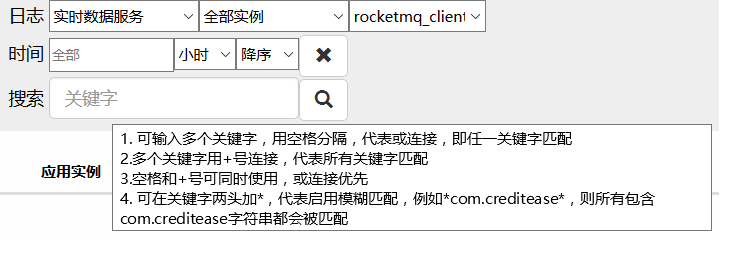
Keywords following Rule 1-3 for perfect match would be highlighted in Results while those following Rule 4 for fuzzy match would not be highlighted.
Clear the Specified Time
Clear the specified time and leave other items unchanged:

Results
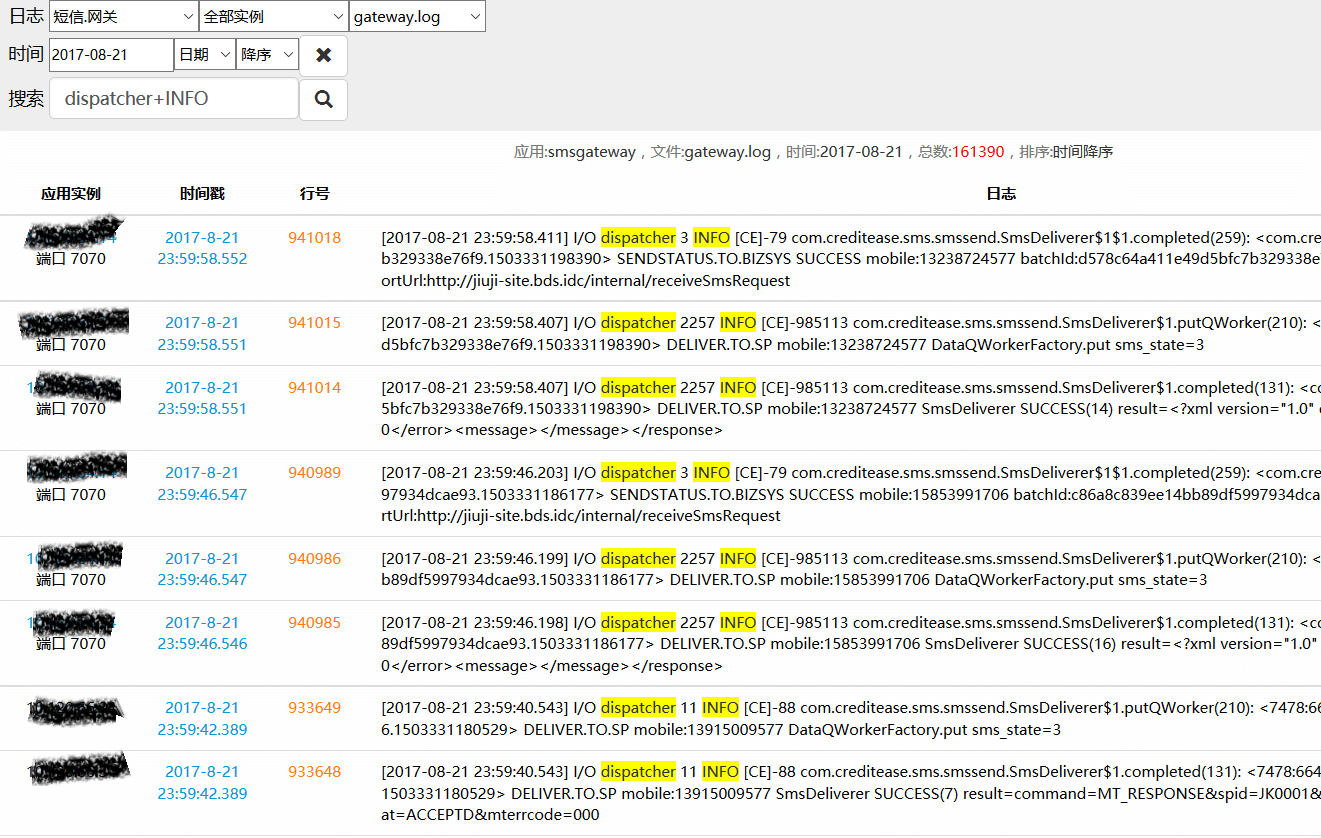
Below are logs containing both “dispatcher” and “INFO” under the specified log path within August 21, 2017 in the descending order of the timestamps:
Scroll through Logs
Click on any log to get to the log srolling page. One hundred logs would be loaded by default, with the clicked one being highlighted in yellow.
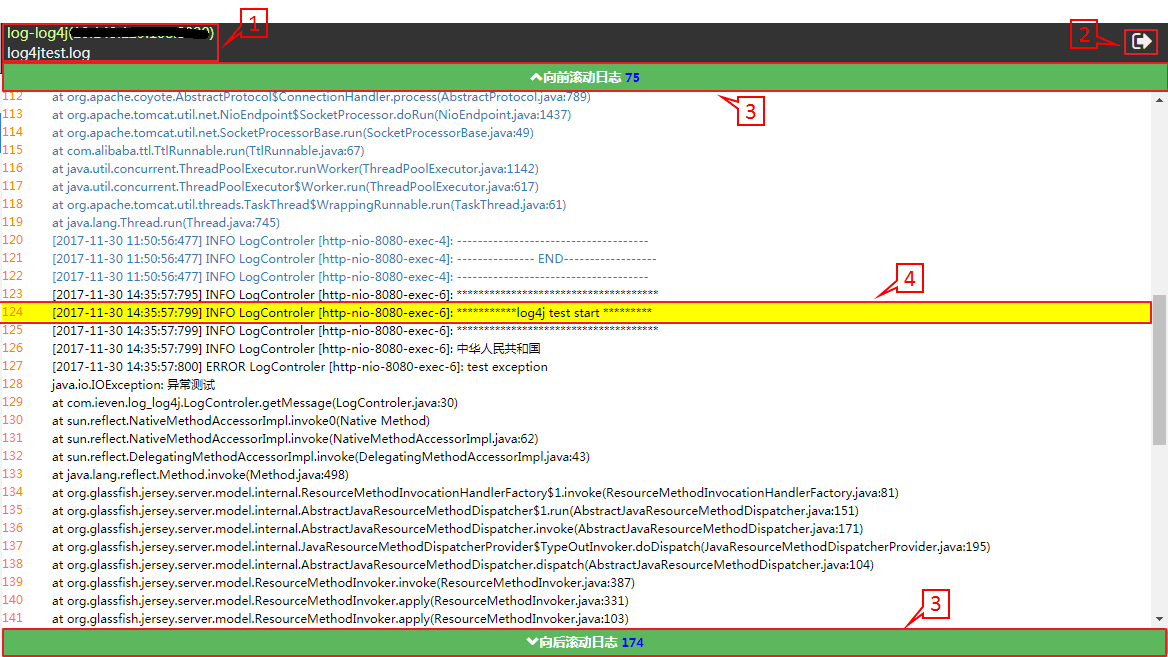
- Name and IP port of the application instance, and name of the clicked log
- Return to the Application Log Query interface
- Click at the bar to scroll logs back and forth. One hundred logs would be loaded at every click. One thousand logs can be displayed within one page at most. When there are over 1000 logs, the first 100 logs would disappear if the bar is scrolled forth and the same case with the last 100 logs if the bar is scrolled back. The blue numbers indicate the line NO. of the logs in the first and last lines among all logs displayed
- Logs in blue can be hyperlinked to the Log-Invocation Chain Correlation page