Application Container Profile
Monitoring Objects
Operating system:
Linux and WindowsProcess (Service process + Java process):
Service process: any process with a listener port
Java process: process started by Java
Running Process
- Automatic scanning every 20 seconds
- Scan processes that are started by users using the same operating system as that of the UAV Monitor Agent
Application Container Instance
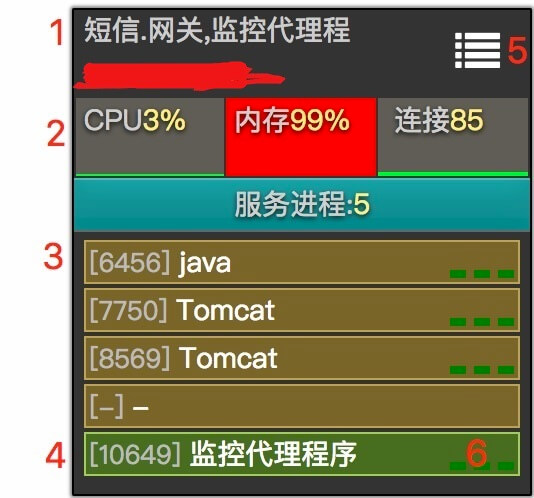
Label
Application programs running on the application container; or the host name if application programs are unidentifiable.
System metrics
CPU use rate, memory use rate (by service processes) and total connections of listener ports. Click to view detailed application container performance.
Process metrics
Inside [] is process ID, followed by application name. Click to view detailed process performance [-] represents processes started by users using the operating system different from that of the UAV Monitor Agent. The profile of such process is not monitored by UAV
UAV Monitor Agent
Process of UAV Monitor Agent.
Click to view application container details
Process status illustration
From left to right: CPU, memory, and connection count. Each item shall has three cells at most: Low (green), medium (yellow), and high (red)
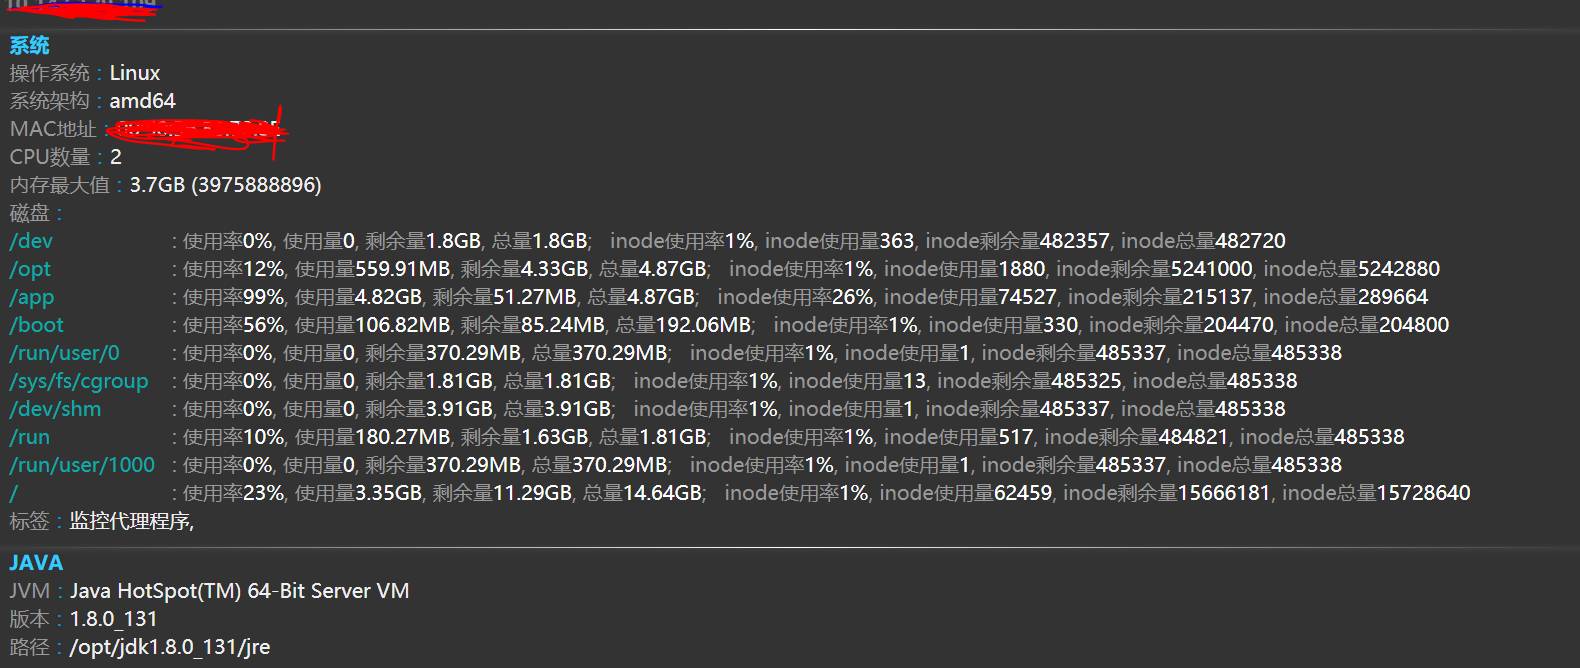
Application Container Details
System information and JVM information
Host name, IP address, operating system information, count of CPU core, memory size, disk information (including inode in Linux), label, and Java information
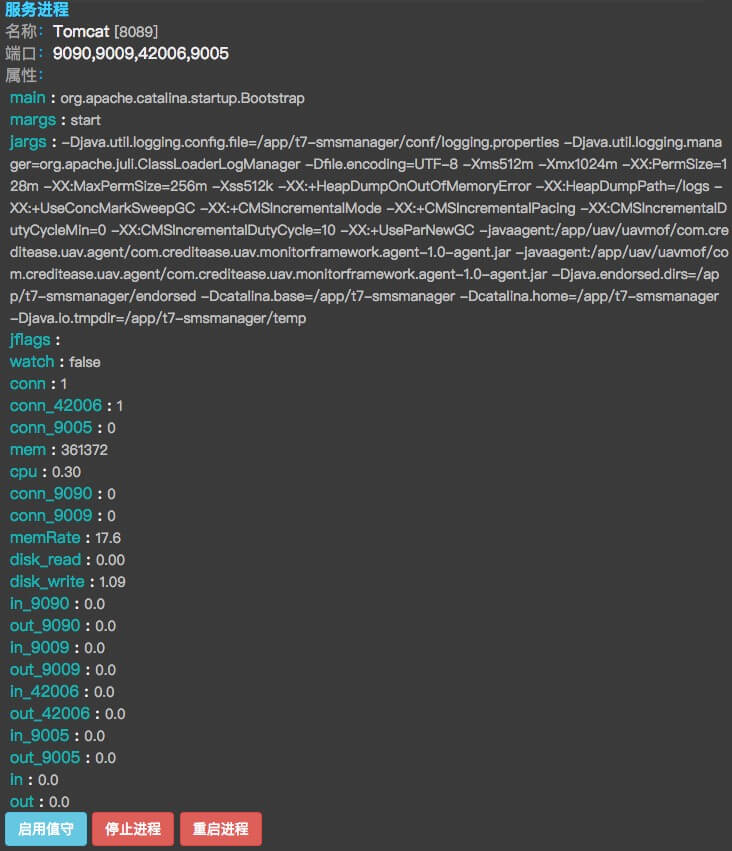
Service process information
Process name, all ports of the process, properties, and remote control over the process. There shall be main, margs, jargs, and jflags in properties of Java processes.
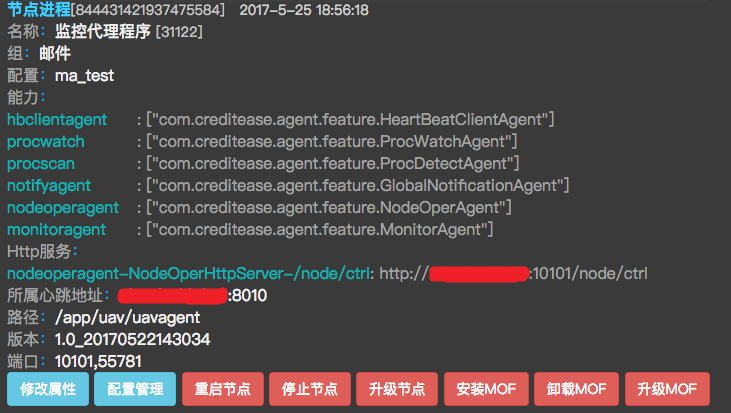
UAV process information
UAV node information and remote control over UAV node