View Alarm History
After the alarm strategy is triggered, the alarm action shall be triggered and the alarm information shall be saved for query. Click on [Alarm History Query] to get to the alarm list view.
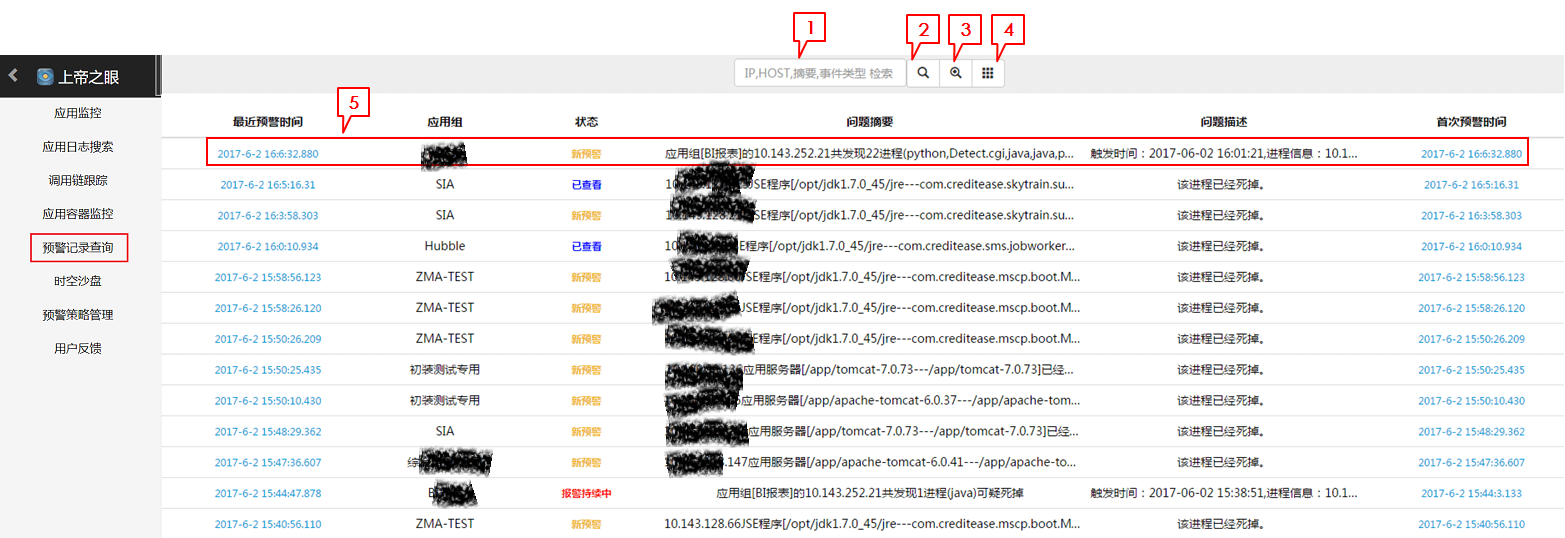
List View
1. Input Box
Enter IP, HOST, abstract and event type to filter alarm records and get fuzzy match results.
2. Query Button
Click on the query button to start searching.
3. Advanced Query Button
Click on the advanced query button to get to the Advanced Query interface.
4. Show-All Button
Click to display all alarms.
5. Alarm Overview Bar
Display overview information of alarms. Click to get to Alarm Details.
- Latest Alarm: time of the most recent alarm
- Application Group: application group to which the alarm belongs;
- Status:
- New Alarm: new alarm event in the initial state
- On-going Alarm: alarm event that is happening
- Checked Alarm: alarm event that has been checked
- Checked & On-Going Alarm: alarm event that is still happening after being checked
- Problem Summary: summary of the reported problem
- Problem Description: overview of the reported problem
- First Alarm: time of the first alarm
Query
Click on the advanced query button in the list view interface to get to the Advanced Query interface.
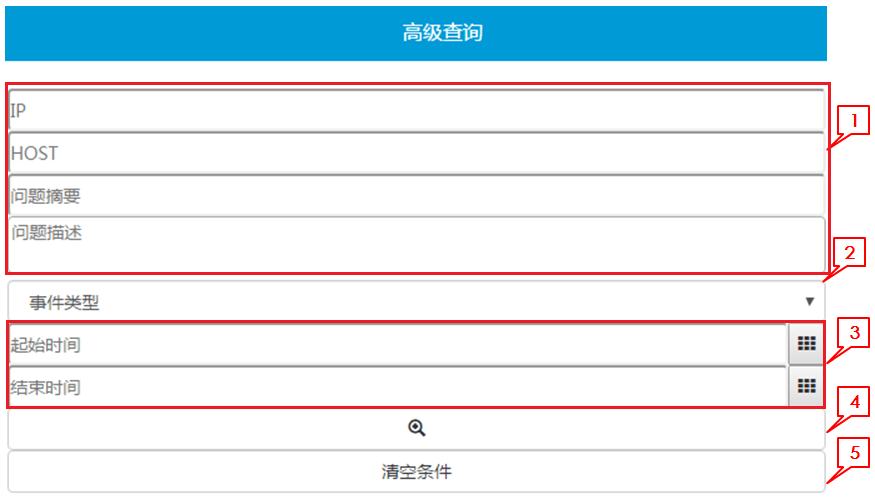
1. Query Items
Optional. Fuzzy match.
2. Event Type
Below are three types of alarm events:
- RT.THRESHOLD: run-time data or container monitoring data trigger alarm strategies
- RT.CRASH: process crashes
- AppServer.ReAccessFail: fail to access data from application middleware
3. Starting Time & Ending Time
Time of the latest alarm event.
4. Query Button
Click to start query.
5. Clear Query Conditions
Click to clear query conditions.