Note: This feature functions only when the log correlation functionality is enabled
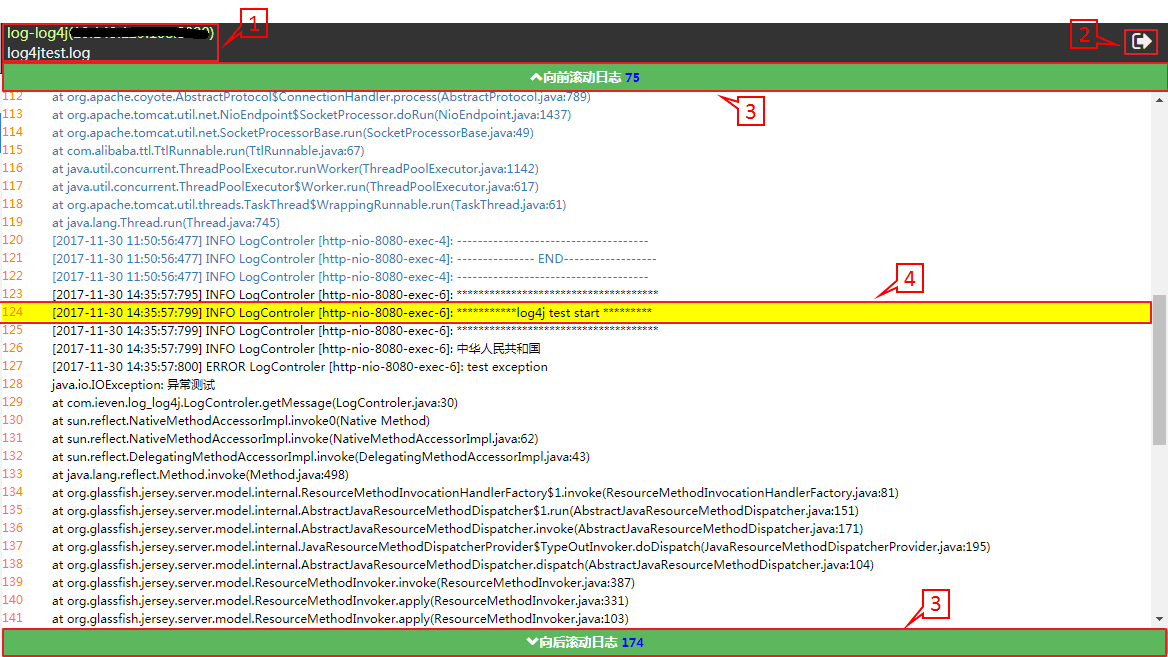
Logs in black indicate no log-invocation chain correlation while those in blue indicate log-invocation chain correlation. Click on logs in blue to find the correlation detailes.
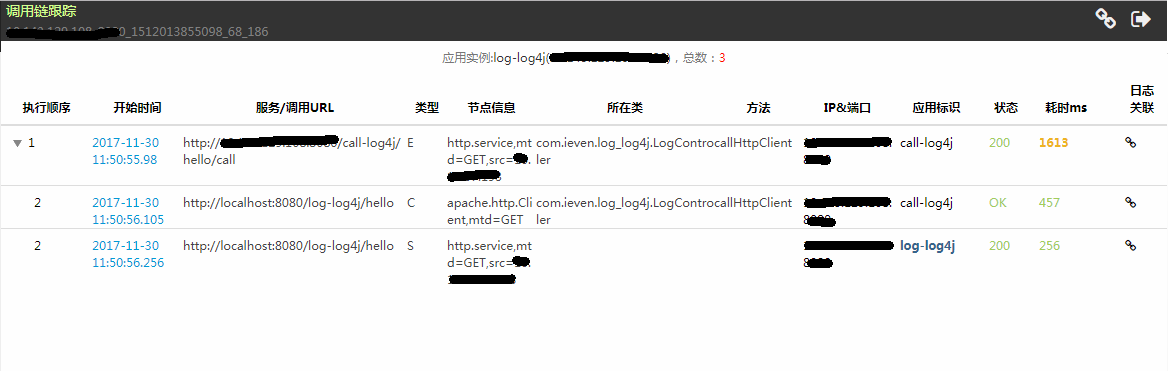
Click on  in the top right corner and get to the Invocation Chain Tracing interface with the name of the application instance and the IP port information. Click on
  in the top right corner and return to the log srolling page (instead of the invocation chain query page). Further details can be found in the invocation chain details interface.