Note: Features below function on the prerequisite that log correlation is enabled
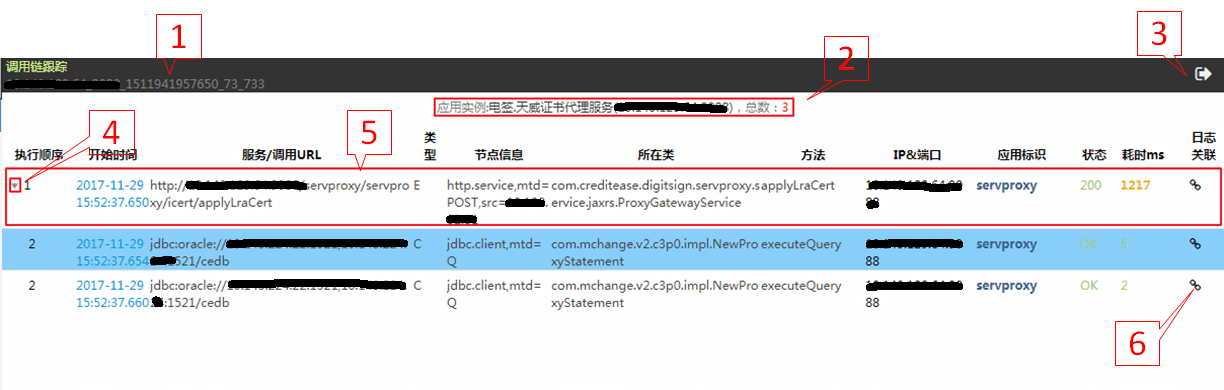
- Click on (6) to pop up the [Choose a Log File] drop-down box and choose the log to be correlated. The name of the log file shall be identical with that in Log Components of the application instance
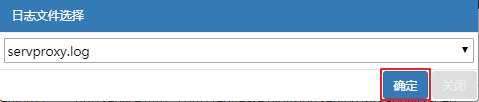
- Choose the log and click on [OK] to get to the log scrolling interface. This interface presents logs generated in this invocation. Scroll upwards and downwards for more related logs.
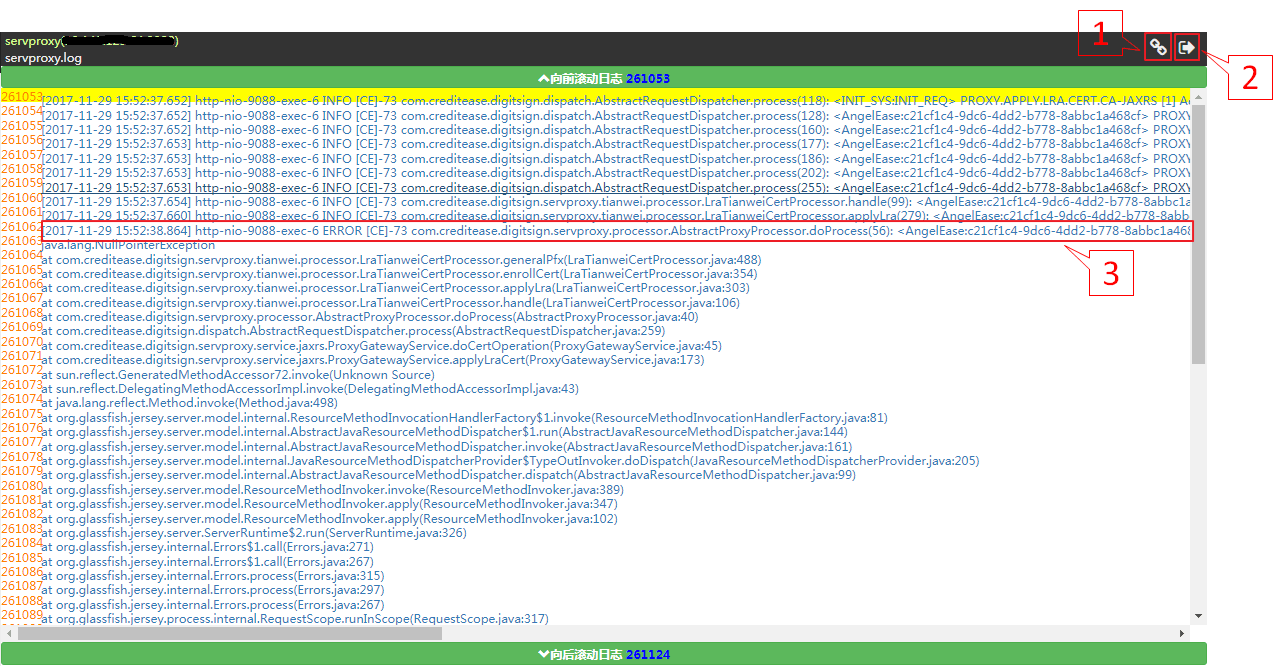
1. Click on this button to get to the [Application Log Query](../57.md) interface with traceid, name of the application instance, IP port, name of the log file in this invocation chain. The user can click to search directly.
2. Click on this button to return to the [Invocation Chain Details] interface (instead of the [Application Log Query] interface)
3. Logs are shown in black if the functionality of Log-Invocation Chain Correlation is not enabled. Enable this feature and the log would be shown in blue. Click on a log and get to the corresponding invocation chain details.
Get to the log scrolling interface for further details.